
Agricultural climate intelligence for Australian agriculture
Agromet's products provide detailed climate analysis, forecasting and monitoring to help farmers, growers, agribusiness and industry understand developing conditions and assess what they may mean for agriculture.
Seasonal Forecast Subscription
The Seasonal Forecast Subscription from November to October provides a detailed assessment of the climate factors influencing Australian agriculture, together with regular updates as the season develops.
It is designed for farmers, consultants and agribusiness wanting to understand the broader climate picture and what it may mean for their region. It has become a highly valuable tool for hundreds of farmers who rely on this to make key planting and management decisions.
Cost for an annual subscription: $600+GST. This can be purchased below for the 2027 season with PayPal or credit card, or you can make email contact on the contact page for an invoice to be sent for electronic Funds transfer. New clients paying before November will receive a complimentary October 2026 climate and Crop Outlook report.
Please note:
Once payment has been made the latest climate and crop outlook report will be emailed to you shortly afterwards. As Agromet is based in Perth a delay in the report can occur for early morning purchases that are made in eastern Australia, or if Dr Stephens is away oversees.
Monthly Detailed Reports
The Australian Climate Outlook at the beginning of the month brings together the major factors influencing rainfall and agricultural conditions. These include global climate drivers (El Niño and La Niña, Indian Ocean Dipole), atmospheric pressure, winds, humidity, ocean temperatures, other climate models, Australian regional forecasting indices, analogue years, seasonal rainfall outlooks, soil moisture and wheat yield ranking maps. David assesses this information and provides his view of what it means for the season ahead. A comparison between forecasted rain and actual rain ends each report.
Fortnightly updates
The detailed monthly report provides the depth of analysis, while the fortnightly update provides a concise summary of what has changed by mid-month from March to October.
Short-term weather information is readily available online. The purpose of the fortnightly update is to save time by bringing together the important information and providing David's interpretation of it on a regular basis.
Schedule
The annual subscription begins in early November with a summer (November to April) rainfall outlook, along with a first look at model projections and analogue years for the following years winter crop season. A long-lead rainfall index that predicts weighted Australian grain belt rainfall in the following year is presented. From February onwards, increased attention is paid to the new lead-index for 10 regions across the Australian grain belt. Rainfall outlooks for the next 3 months and the May-October growing season then come into play with a now-time index. The now-time index is more important from May onwards.
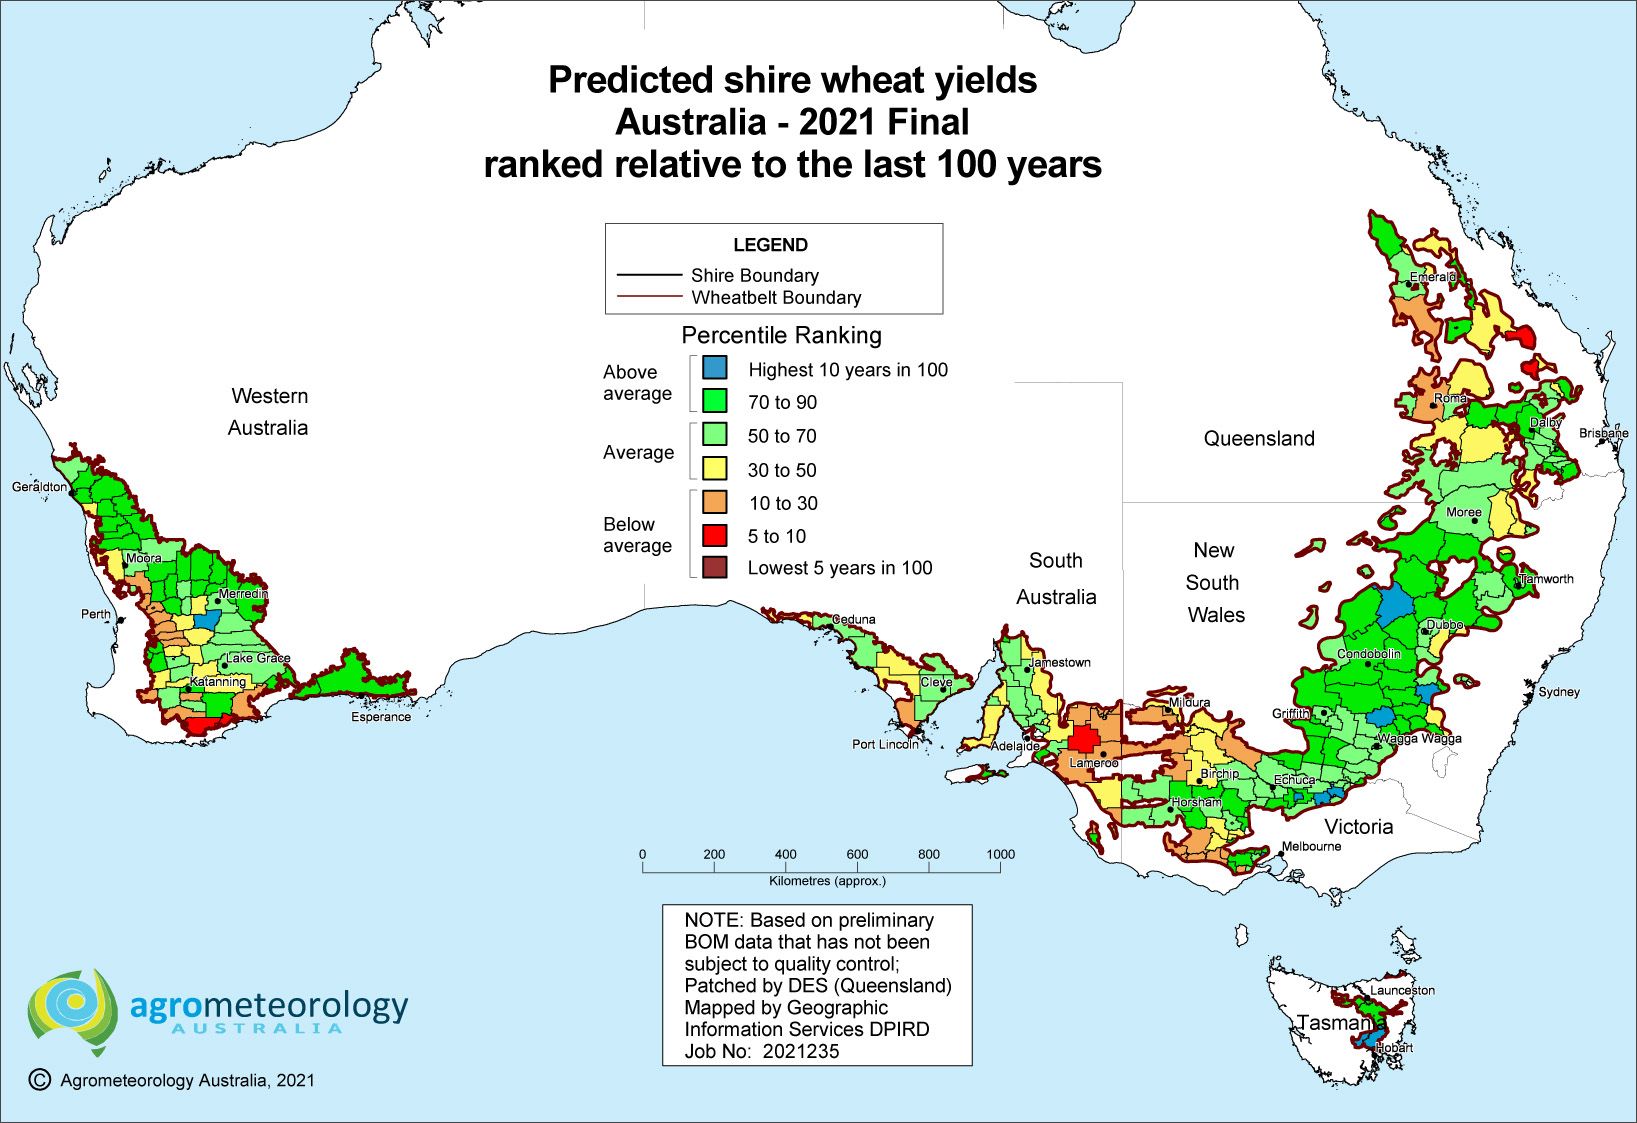
National Soil moisture ranking maps are provided from November to May, and then National shire wheat yield ranking maps are provided from June to October.
2026 Season Update
Even though most climate models had a very dry outlook for south-eastern Australia my new lead-index jumped in March and went positive for South Australia and Victoria (bit later for southern NSW). From the 5th May I said that the 2023 analogue was the top ranked analogue for eastern Australia, which was related to more normal rain in south-eastern Australia and drier weather in northern NSW and Queensland. In Western Australia, my lead-index went negative mid-year and my forecasts discussed from as early as the 7th April a drier south-west corner and a good season in the northern two thirds of the grain belt.
Maps – Wheat Yield Rankings
Regional crop monitoring and historical yield rankings
Agromet's crop monitoring system uses climate information from more than 1,000 real-time rainfall measurement stations across Australia.
The system provides regional information on soil moisture and crop conditions and produces wheat yield rankings maps.
Cost: $100 + GST for a national map. For publications that disseminate maps outside an organisation, a national map is $600 + GST.
What the maps show
These ranking maps show how current conditions compare with historical seasons, including 100-year model comparisons. The maps provide a visual picture of regional soil moisture conditions and crop yields compared to the last 100 years of modelled outputs. This regional and historical comparison provide a powerful summary of where crop conditions are above or below average. They help show how rainfall and soil moisture are translating into crop prospects.
Individual maps are available for specific requirements.
Grain Productivity Changes
Understanding changes in grain productivity
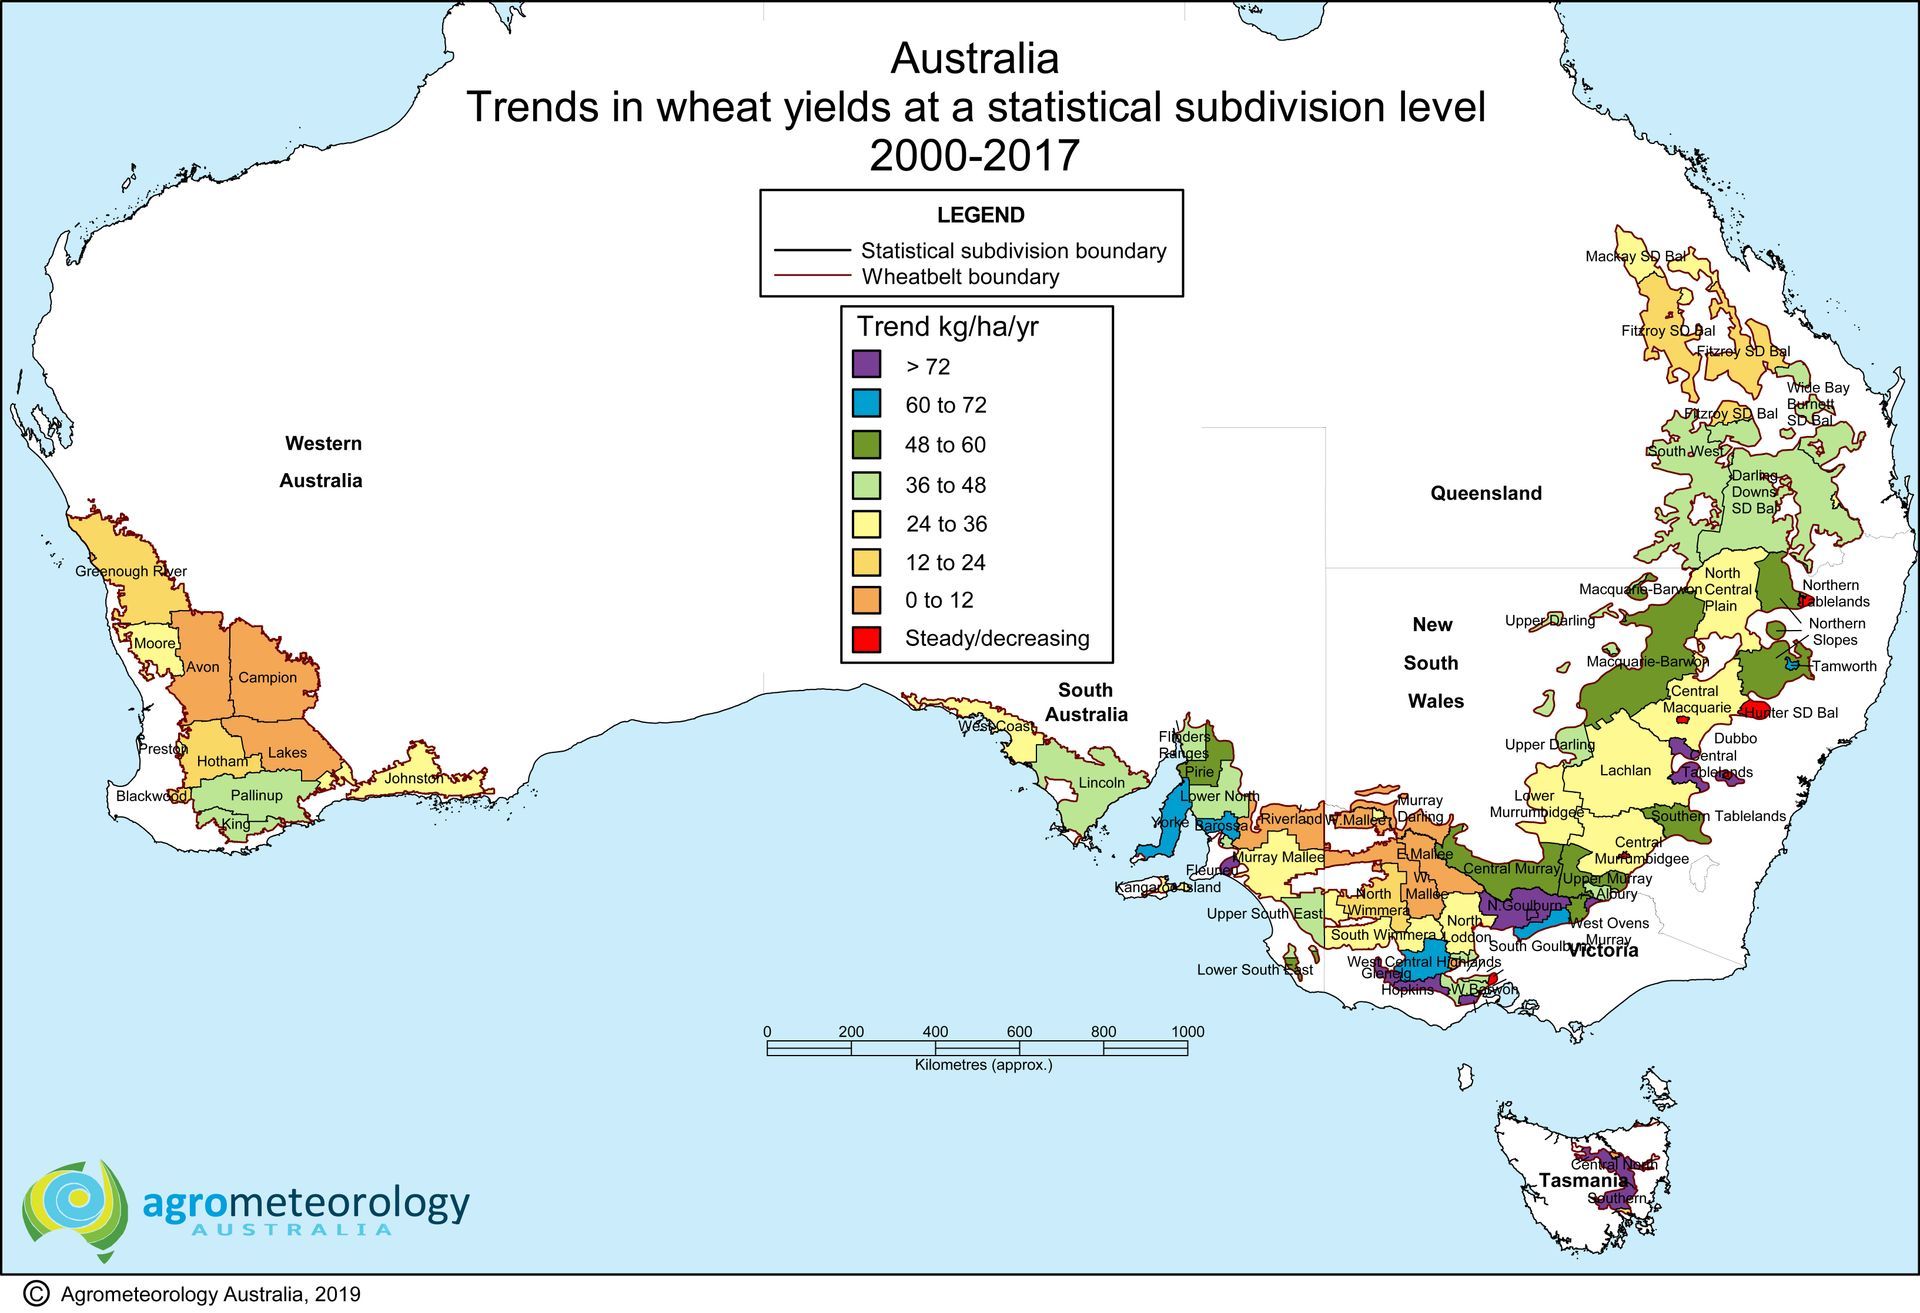
Agromet analyses grain productivity and crop yield trends across Australian agricultural regions, examining how productivity has changed over time and how regions compare.
Consultancies and maps can be provided on changes in water use efficiency regionally across Australia for the major winter crops wheat, barley and canola. Factors that are driving regional differences in productivity gains can be summarized. Climate change and it impacts on crop production can also be outlined regionally across Australia within a crop modelling framework.
Farm Portfolio Risk
A spreadsheet of shire crop yield and variability can be modelled within the STIN forecasting system.
Production variability can be optimised for a mix of properties spread across the grain belt, i.e. reduced agricultural portfolio risk.